The Crop Report
Q4 2025 - "What's Your Number?"
We recently announced the launch of Harvester Insights and are excited to share Edition 2, “What’s your number?” This quarterly report provides a forward-looking, detailed analysis of current financial and investment topics.
This edition explains the 4% Rule with Guardrails: Withdraw 4% of your annual savings as a spending limit, adjusted each year for inflation. Guardrails allow your spending to go up or down, so you never run out of money and can live confidently knowing your number.
What's your number?
The single, stress-tested figure that answers, “How much can I spend for the rest of my life?”—whether quitting the day job, buying Courchevel chalets, or funding a nine-figure foundation—all while ensuring wealth grows faster than total spending.
This question quietly arises in conversations at birthday parties, over cocktails, family dinners, or in meetings: What’s your number? Do I have enough? It's not just about a dollar amount; it represents the sum of life's work and the harvest of "financial" crops needed to live fully, free from the fear of running out.
But freedom without a plan? That’s when things begin to fall apart. Mike Tyson earned around $400 million in the ring. Gold-plated cars, Bengal tigers, mansions — he spent freely, never believing he would run out of money, which led to bankruptcy in 2003. Lottery winners? About 70% go broke within a few years. Even brilliant, high-earning executives and founders quietly overspend.
Even the wealthiest families need protection from “bad weather.”
- Market Crashes
- Inflation eating your purchasing power
- Taxes taking a bite
- Lifestyle creep (that “just one more” vacation home)
Your number isn’t just how much—it’s how safe.
The 4% Rule: Your Baseline
Imagine your savings as a field of grain. The 4% Rule (created by William Bengen in 1994) says:
Harvest 4% of your field each year; it should last 30 years.
Example:
- Portfolio of stocks and bonds = $10 million
- Year 1 withdrawal = $400,000
- Adjust upward based on annual inflation (e.g., 3%)
- Year 2 withdrawal ≈ $412,000
- Year 3 withdrawal ≈ $424,000
Based on history (stocks ~7% real return long-term), this strategy works most of the time. But here’s the catch:
What if you retire right before a drought?
- 2000–2002 (Dot-Com Bust): Markets dropped ~50%
- 2008–2009 (Financial Crisis): Another ~50% plunge
You'll run out of money if you keep pulling $400K+ while your field shrinks. This is called sequence-of-returns risk—bad timing at the start can ruin decades of saving.
However, there is a plan designed to help you feel more confident.
4% Rule with Guardrails Strategy
The Guardrails Strategy (Guyton & Klinger, 2006) incorporates dynamic adjustments to the 4% rule for downturn protection. ¹
For a $1 million portfolio:
- If the portfolio declines 20% below its initial value (from $1 million to $800,000), reduce withdrawals by 10% (from $40,000 to $36,000).
- If the portfolio increases to 120% of its original value (to $1.2 million), increase withdrawals by 10% (to approximately $44,000).
The 4% rule with guardrails raises the Success Rate over 30 years by about 9.4 percentage points compared to the standard 4% rule. Success Rate (or Success Ratio) indicates the percentage of 30-year retirement periods, historical or simulated, during which the portfolio does not run out of money before the period ends.
This improvement comes from flexible adjustments that better respond to market volatility, reducing failure risk while allowing higher sustainable spending overall.
Hypothetical performance, including 4% rule and guardrails scenarios, is illustrative and excludes real-world factors like taxes, transaction costs, or liquidity constraints.
Case Study: $1 million portfolio Through 2000 - 2012
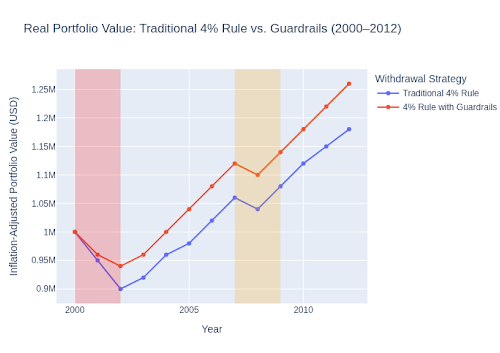
To demonstrate a guardrail strategy, we modeled a $1 million portfolio of stocks and bonds invested during a difficult period starting in January 2000, before the Dot-Com bust, through the Great Financial Crisis (2008–2009), with withdrawals adjusted for 3% annual inflation.

Disclaimer: Past performance is not indicative of future results. The $1M case study reflects historical data from 2000–2009; actual results vary based on individual factors like risk tolerance, fees, and market conditions.
This graph displays the period from 2000 to 2012, showing how long it took for a $1 million portfolio to break even after adjusting for inflation. By 2009, the portfolio following the 4% Rule with guardrail remained resilient, supporting long-term goals. This flexibility improves the ability to withstand market storms, taxes, and inflation.
Longevity and Sustainability of Withdrawals
Now that we understand how these different approaches perform in adverse markets, what is the longevity and sustainability of these portfolios over 35 years? If we assume a person is 60 and lives until age 95, will they outlive their money?
Here is a graph showing the probability of Success Rate over a 35-year horizon for each strategy, using a Monte Carlo simulation, a computer-based method that employs repeated random sampling to model different outcomes.

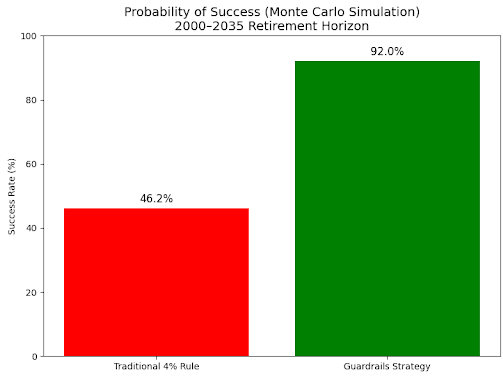
Success ratio: % of 10,000 Monte Carlo simulations where a 60/40 portfolio lasts 30 years using 4% initial withdrawal (inflation-adjusted). Past performance is not indicative of future results.
Monte Carlo Success Rate: percentage of over 1,000 random scenarios where your plan never runs out of money.
- 4% Rule: 46% success (works in 460, fails in 540).
- Guardrails: 92% success (works in 920, fails in 80).
92% is strong—but many focus on the 8% failure (running out in 80 scenarios). How can you protect against that 8%?
Create Protective Reserve
Build a buffer equal to 2 years of spending to weather severe downturns ("belt and suspenders").
- Bear Market: Draw from reserve for the first 2 years; let equities recover.
- Guardrails: Include a self-insurance fund to protect 4% withdrawal.
- Recovery: At 120% of the initial value, use “pay increase” to rebuild the reserve.
Two Takeaways
- Protective Reserve: Self-insure for 2 years of spending.
- Diversify: Bonds may outperform in risk-off scenarios.
Tech: Your Automated Farm Manager
Knowing your “number” and building a protective reserve are the first steps. Monitoring it is the second step.
Old method: Spreadsheets, statements, hours wasted.
New approach: Fintech dashboards consolidate everything into a single, comprehensive view.
- Bank accounts
- Investments
- Real estate
- Private equity
Benefits:
- Real-time alerts when guardrails trigger
- Tax-loss harvesting (sell losers to cut taxes)
- Performance vs. goals (grandkid’s college? Charity?)
- Identify which discretionary spending to stop during a market crash.
Time saved equals money earned. Automate reporting to save months over ten years for family, travel, or your dream vineyard. The dashboard allows you to focus on what matters: your time.
Your Number = Your Process = Your Legacy
In conclusion, begin with the 4% Rule with Guardrails, Protective Reserve, and intelligent technology—contact Harvester Wealth today to stress-test your plan and protect your family’s prosperity for generations.
Rooted in your success,
The Harvester Wealth Team
Click to schedule a call with the Harvester Wealth Team
¹Guyton, J., & Klinger, W. (2006). Decision Rules and Maximum Initial Withdrawal Rates. Journal of Financial Planning.
Disclaimers
Harvester Wealth Management, LLC is a registered investment adviser with the Texas State Securities Board. Registration does not imply specific skill or training. This newsletter is for informational purposes only, not investment advice or a solicitation to buy securities. Consult your advisor for personalized guidance.
Hypothetical performance, including 4% rule and guardrails scenarios, is illustrative and excludes real-world factors like taxes, transaction costs, or liquidity constraints.
All investments carry risks, including loss of principal. The guardrails strategy does not eliminate market or economic risks. Charts are based on historical/hypothetical data.
Important Disclaimer Regarding Monte Carlo Simulations: The Monte Carlo success rates and projections presented in this newsletter are hypothetical in nature and are based on simulations using historical market data, assumed returns, volatility, and other inputs that may not reflect actual future market conditions, economic environments, or your individual circumstances. These results do not guarantee any specific outcome and are not representations of past or future performance. Actual results may vary materially due to market volatility, sequence of returns, inflation, taxes, fees, and unforeseen events. This analysis is for illustrative and educational purposes only and should not be construed as investment advice, a prediction of future performance, or a guarantee of results. No representation is made that any account will or is likely to achieve profits or avoid losses similar to those shown. Before making any investment decisions, consult with your financial advisor to determine if these concepts are suitable for your unique financial situation, objectives, and risk tolerance. Additional information about our firm, including our Form ADV, is available upon request or at adviserinfo.sec.gov.
Forward-looking statements about guardrails or portfolio reporting benefits are subject to market and economic uncertainties. Contact insights@harvesterwealth.com for details.